Evaluating market ratings
I’ve blogged a bit previously about deriving team strengths from market odds. In this post, I want to look a little at validating and evaluating the team ratings.
The model workings and motivation are explained in more detail here. The short version, the model uses moneyline (Home/Draw/Away) odds to infer team strengths (and home field advantage). You can also explore the model’s ratings here.
Method
There are a few different ways we could attempt to validate a model like this. For this post, I thought a fun way would be to test predictions against the market itself. The method goes like this:
- For each game…
- Make a prediction using the market ratings model
- Place a bet, staking according to the Kelly Criterion
- Find the profit/loss
I should note that the bets are placed independently. This means that the “bankroll” isn’t updated after each game’s bets are evaluated to stop the ordering of games from having a big influence on the headline figures.
In evaluating the bets, I’ve given the model a generous 2 seasons of “burn-in” to let the team estimates stabilise. This leaves us with 4 seasons of bets (2014/15 - Present) in 19 different competitions.
Lastly, I’ve also thrown in a benchmark model that ignores team strengths and always predicts the same probabilities for Home/Draw/Away. This comes to about 46% / 26% / 28% for the Premier League[1].
Results
One thing we can do is look at the headline figures for each bookmaker:
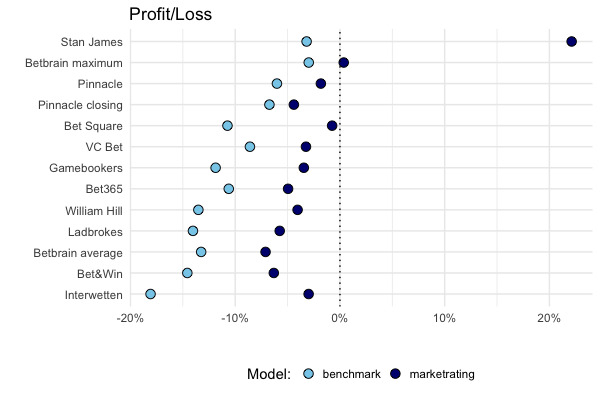
The first thing to point out is that the Stan James brand closed recently. It’s tempting to suggest we can see why. Maybe we can. That said I’ve no idea how solid the football-data.co.uk data is for this particular bookmaker. Either way, I’m removing them from the rest of the analysis.
The second thing to note is that the model beats the benchmark at each bookmaker, as it should. Interestingly, the performance is closest between the two at Pinnacle’s closing odds, which are the sharpest of the books the models we were “betting” against.
Over the whole sample, the model comes out with a profit against “BetBrain maximum”. That is, the maximum odds available from a selection of bookmakers according to BetBrain.com. I suppose this shouldn’t be too surprising, if the model can pick the best odds available, of course it should do well. It also comes pretty close to break-even at Bet Square, but struggles elsewhere.
I think these results are basically what we should expect from a model like this. After all the model, only uses market (closing) odds, so outperforming the, uh, market is clearly a bit of a reach [2].
Super Sundays
There’s an interesting kink in the model’s results when we split the bets by the day of the week. NB: each point refers to the model’s profit/loss, against a given bookmaker on a given day of the week.
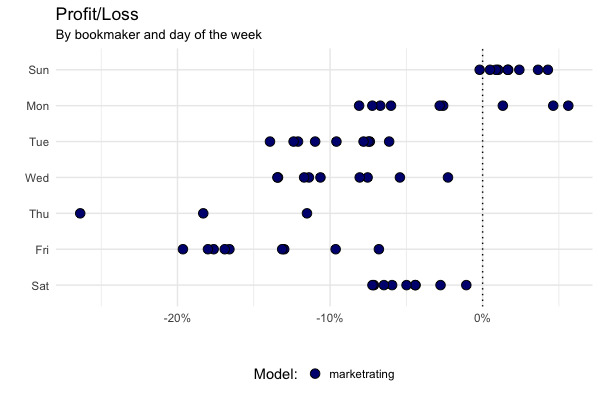
It’s a result that looks a bit weird at first, and one that nicely illustrates the importance of knowing your data before embarking on any analysis.
The model does terribly on weekdays (with the minor caveat that there are much fewer games on these days), relatively poorly on Saturdays, but really well (all things considered) on Sundays.
To understand this, we need to look back at football-data.co.uk (the source of the data used here).
Please note that the odds are collected for the downloadable weekend fixtures on Fridays afternoons generally not later than 17:00 British Standard Time. Odds for midweek fixtures are collected Tuesdays not later than 13:00 British Standard Time.
As we get closer to kickoff time, the market’s (or bookmakers’) prices become more efficient (closer to the “true” probabilities), and therefore harder to beat. One way to think about this is that as more people place bets, they add information to the market’s prices in a wisdom-of-the-crowds effect.
Because all the odds are collected on Fridays (or Tuesdays), the recorded prices are more efficient for Friday and Saturday games than they are for Sunday games. Therefore the model has a bigger advantage in Sunday games, because the prices used in my backtest are two days old (as opposed to one day old for Saturday games).
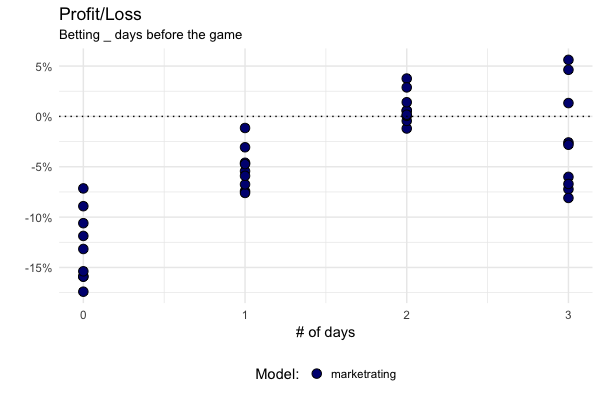
In the backtest, it is as if the model gets to place all its bets on Fridays and Tuesdays. Therefore it can get in very early for Sunday games, when the prices are still fairly inaccurate. Viewed like this, the model’s advantage becomes that much clearer:
April is a cruel-lish month
Lastly, we can look at the model’s performance over the course of the year:
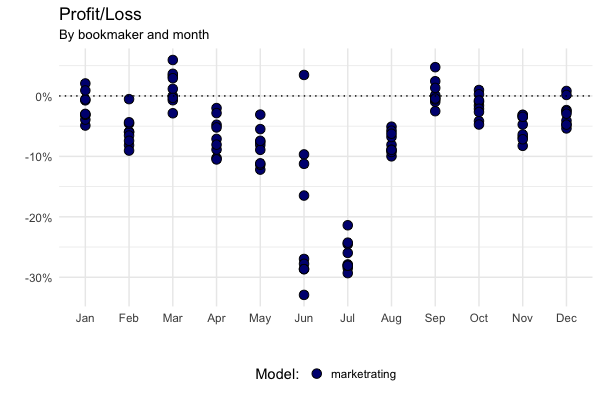
The model performs particularly badly at the start and end of the footballing season [3]. I think the reasons for this are relatively straightforward. Clubs change players and coaches over the Summer transfer window and therefore the teams’ strengths change too. The model cannot incorporate this information directly and instead has to infer it from changes in the market’s prices. This takes some time, and so the model performs badly for the first couple of months of the season.
At the other end of the season, teams face different motivation effects as some teams have a lot to play for, while others don’t. Again, this is something the model does not incorporate directly and so it suffers relative to the market.
I thought this was a fun way to evaluate this kind of model, and hopefully helps explain a bit about how the model works. As I mentioned at the top, there’s a little web app for exploring the ratings throughout the season, as well as some code and notes on github.
The benchmark model actually cheats a little here. I took the % of home wins, draws, and away wins from 2012/13 to present to estimate the probabilities of those events occurring. In effect, this means that when the benchmark model was “predicting” a game’s outcome, it had the same game in the training set! Of course, in practice the benchmark model is so simple (and bad), this doesn’t give it much of an advantage at all. ↩︎
Strictly speaking, the model is predicting the Pinnacle closing line (the data it’s trained on), rather than actually predicting the football matches themselves. So to make a profit against the rest of the books, two things must be true: 1) The closing prices are a better predictor of the match outcome than the bookmakers’ prices. 2) The model is a better predictor of the closing line better than the bookmakers’ prices. ↩︎
Since all of the leagues in question are Winter leagues, I’ve just aggregated by month. ↩︎